An interactive 3D Earth globe is more than a visual toy. It is a practical geographic instrument that helps users explore latitude, longitude, Earth rotation, night and day zones, relief, and map views in a way that flat atlases cannot match. Instead of reading coordinates as abstract numbers, the user sees their meaning on a rotating planet. That makes this kind of online globe useful for education, geography, navigation basics, astronomy, logistics, travel planning, and general spatial understanding.
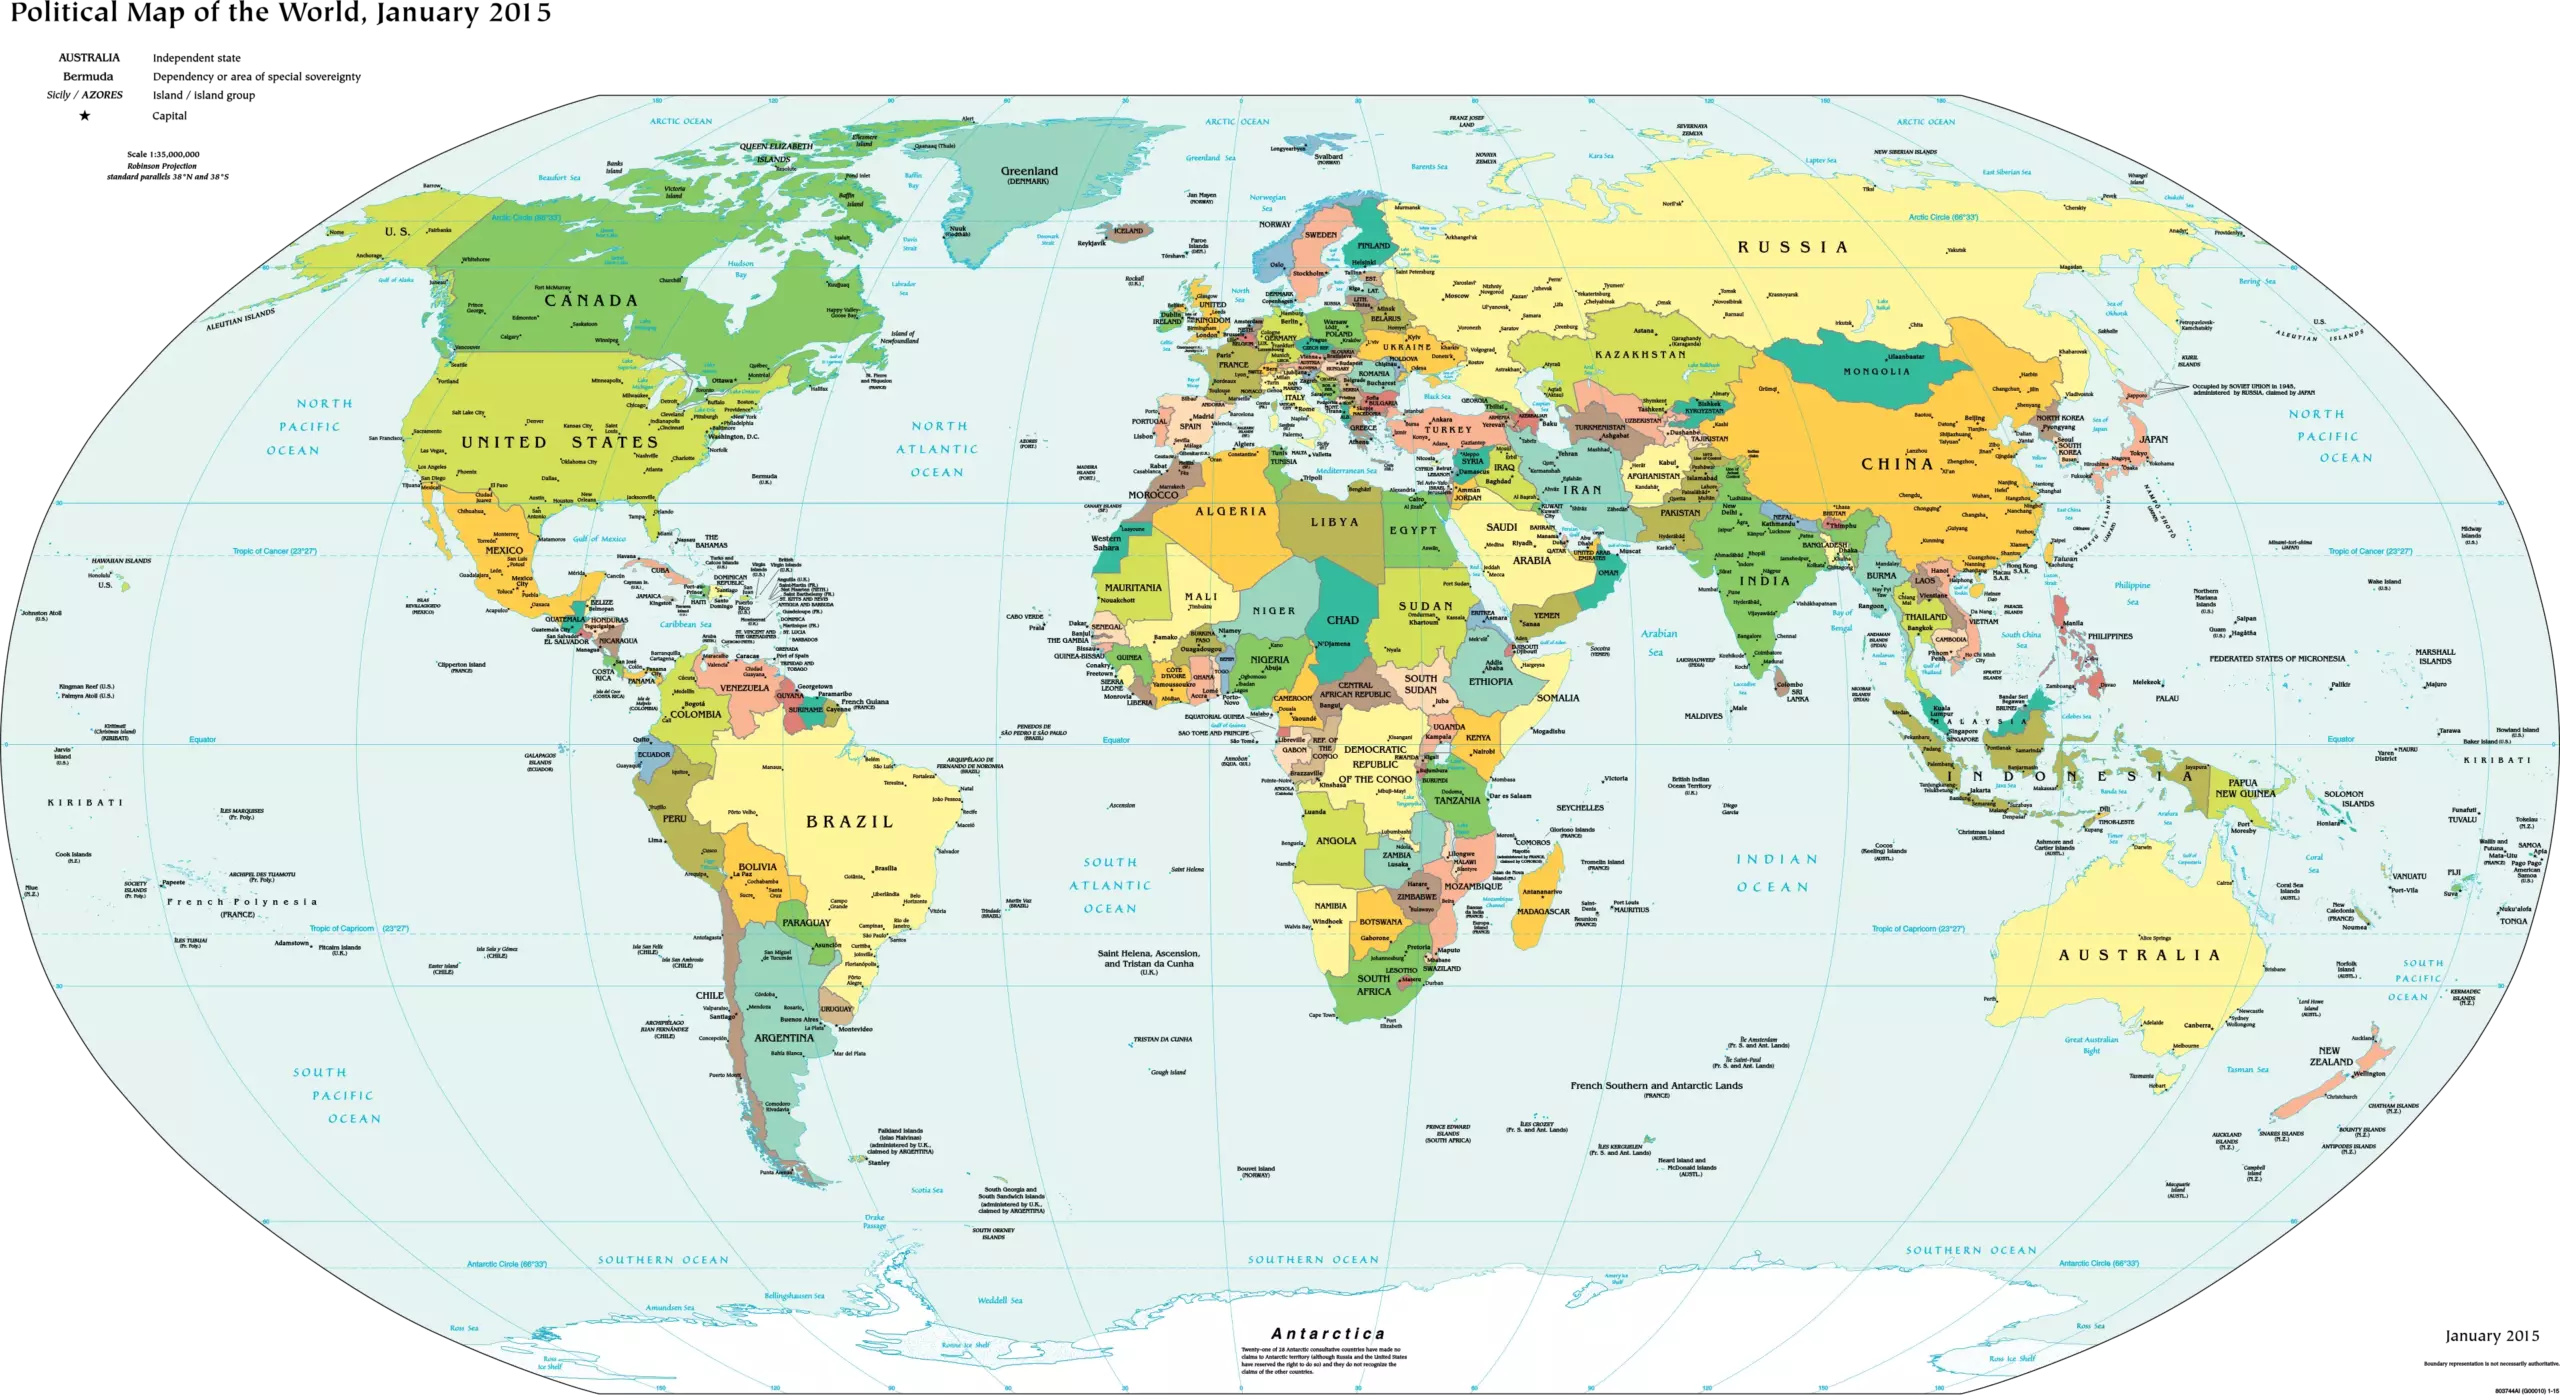
This type of globe is especially effective because it combines three things at once: a realistic planet model, coordinate controls, and live visual feedback. When latitude changes, the marker shifts across the north and south directions. When longitude changes, the position moves east or west. When the globe rotates, the user can inspect continents, oceans, polar regions, and the relationship between a point on Earth and the surrounding surface. This is exactly why a 3D globe is often more intuitive than a map for first-time learners.
Contents
What this online Earth globe is for
The main purpose of an interactive 3D Earth globe is to let a user examine the planet as a real spherical body rather than as a rectangular projection. A flat map always introduces distortion. The poles become stretched, long distances can look smaller or larger than they really are, and directions may feel compressed. A globe removes most of that mental translation. The visual result is cleaner, more natural, and easier to understand for many tasks.
🌎 In practical work, the globe can be used to locate cities, mark survey points, estimate hemispheric position, compare time zones, or study how daylight moves across Earth. In teaching, it helps explain the relationship between coordinates and the physical shape of the planet. In content projects, it can also serve as an engaging interactive element for websites about geography, Earth science, astronomy, climate, travel, or satellites.
The control set in this kind of tool usually includes latitude, longitude, map style, relief style, night view, auto rotation, and fullscreen mode. Each control affects a different layer of understanding. The user can move from a simple coordinate check to a more complete visual analysis of the globe in a few seconds.
Main controls and what they do
| Control | What it changes | Practical use | Typical result |
|---|---|---|---|
| Latitude | North or south position | Finding a parallel on the globe | The marker moves toward the equator or a pole |
| Longitude | East or west position | Locating a meridian | The marker shifts around the globe |
| Map mode | Surface appearance | Geographic reference | Clear country and coastline view |
| Relief mode | Terrain depth and elevation | Studying mountains and landforms | More realistic surface texture |
| Night mode | Lighting conditions | Understanding the dark side of Earth | Useful day and night contrast |
| Rotate | Automatic motion | Passive viewing and presentation | The globe spins continuously |
| Fullscreen | View size | Better visibility on large screens | More space for inspection |
These controls are intentionally simple. A strong interactive globe should not overwhelm the user with unnecessary panels or technical clutter. The best interface is the one that lets the globe itself remain the main object. The controls should guide the eye, not compete with it.
Why latitude and longitude matter
Latitude and longitude are the foundation of global positioning. Latitude measures how far a point lies north or south of the equator. Longitude measures how far a point lies east or west of the prime meridian. Together they define any location on the Earth’s surface with high precision. On a 3D globe, these numbers stop being abstract and become visible movement.
Latitude values range from -90° to +90°. The equator is 0°. Positive values point north, negative values point south. Longitude values range from -180° to +180°. The prime meridian is 0°. Positive values are east, negative values are west. These conventions make it possible to describe every surface location using a simple pair of coordinates.
✍ For example, a point near 51.5° N and 0.1° W is close to London. A point near 40.7° N and 74.0° W is close to New York. A point near 35.7° N and 139.7° E is close to Tokyo. A globe lets the user see those positions immediately, which is a major advantage for learners and for anyone who needs geographic clarity.
Coordinate format and conversion
Many tools allow coordinates to be entered in degrees and minutes. This is useful because coordinates are often written in a mixed format. In the simple degree-minute system, one degree is divided into 60 minutes. The general conversion is easy:
Ldecimal = D + M / 60
Here, D is the degree value and M is the minutes value. If the direction is south or west, the value is negative. This means 12° 30′ south becomes -12.5° in decimal notation. The same rule applies to longitude.
Another common transformation is converting minutes back to decimal degrees. That is useful when a user has precise coordinates from a report, a GPS note, or a data table and needs to enter them into a visual globe interface.
M = 60 × |Ldecimal – D|
When a globe accepts both input styles, it becomes much more practical for real use. Beginners can work with whole numbers first, while advanced users can enter exact positions with more detail.
Useful formulas for globe-based calculations
Interactive Earth globes are primarily visual tools, but they also connect to real calculations used in geography, cartography, and astronomy. The following formulas are common in practical work and education.
| Formula | Meaning | Use | Notes |
|---|---|---|---|
| φ = latitude | Angular north-south position | Locating parallels | Measured in degrees |
| λ = longitude | Angular east-west position | Locating meridians | Measured in degrees |
| d = R × θ | Arc length on a sphere | Great-circle reasoning | θ must be in radians |
| θ = arccos(sin φ1 sin φ2 + cos φ1 cos φ2 cos Δλ) | Central angle between two points | Distance on the globe | Used in spherical geometry |
The simplest distance relation on a sphere is arc length. If the Earth radius is R and the central angle is θ, then the surface distance along the sphere is d = R × θ. This is the core idea behind many map and globe calculations. It is not a flat distance. It is a path along curvature.
📐 For rough Earth-based work, the mean radius is often taken as about 6371 km. That allows approximate great-circle distances to be computed when a user needs a geographic estimate. For instance, the straight spatial distance through space is not relevant for travel. What matters is the route along the curved surface.
The approximate north-south distance from the equator can also be estimated with latitude alone. Since one degree of latitude is close to 111 km, the formula is practical in many quick calculations:
Distance ≈ 111 × |Δφ|
This is only an approximation, but it is useful when the user needs a fast mental estimate. A globe helps make the result visible instead of purely numerical.
How the visual modes help understanding
- Map mode is the best choice when the user wants a clean cartographic reading. Country outlines, land and water contrast, and overall orientation are easier to interpret in this mode. It works well for locating regions, tracking meridians, and comparing continents.
- Relief mode adds terrain depth. Mountains, ridges, and highland regions become easier to identify. This is important because topography affects climate, river systems, population distribution, road planning, and even flight routes. A relief globe can communicate these patterns more clearly than a plain political map.
- Night mode is useful for understanding day-night separation on Earth. It is not only visually attractive. It also supports astronomy and Earth science explanations. When light and shadow are shown on the globe, users can see why the same moment produces daylight in one region and darkness in another. That makes time zones and solar angles much easier to grasp.
- Auto rotation is valuable for demonstrations. A static planet can be examined carefully, but a rotating planet creates a stronger sense of scale and motion. It helps the user remember that Earth is not a fixed image. It is a dynamic sphere with continuous rotation, changing illumination, and constantly shifting surface visibility.
Where this kind of globe is useful in real work
- An interactive 3D Earth globe has many practical applications. Teachers use it to explain geography and planetary motion. Students use it to learn coordinate systems. Web developers use it as an educational feature. Content creators use it to make articles, landing pages, and knowledge tools more engaging. Travelers use globes to visualize route direction, country position, and continental separation. Planners use them to understand location context in a more intuitive way than a flat map provides.
- It is also helpful in discussions about satellite orbits, Earth observation, climate zones, and navigation. When a user sees the whole planet, the relationship between local information and global structure becomes much clearer. A city, a sea, or a mountain range is no longer an isolated label. It is part of a larger physical system.
- In business and technical content, the globe is a strong visual metaphor for global scale. It instantly suggests coverage, international reach, worldwide data, and planet-wide relationships. This is one reason Earth globe widgets remain popular in scientific pages, education platforms, and geospatial dashboards.
Common user tasks and the best mode for each
| User task | Best mode | Why it helps | Result |
|---|---|---|---|
| Find a location by coordinates | Map mode | Clear boundaries and orientation | Fast point recognition |
| Study mountains and terrain | Relief mode | Shows surface height differences | Better physical geography reading |
| Understand daylight and darkness | Night mode | Shows illuminated and dark regions | Clear solar context |
| Present the globe on a projector | Fullscreen and rotate | Large visual impact | Better audience focus |
| Teach coordinate basics | Latitude and longitude controls | Direct movement on the sphere | Stronger conceptual learning |
Reading the globe correctly
When using a 3D Earth globe, it helps to think in spherical terms. Directions do not behave exactly like they do on a flat page. Moving east or west follows a curved path around the planet. Moving north or south changes the angular position relative to the equator. This is why a point near the poles behaves differently from a point near the equator.
The prime meridian and the equator are the two reference lines that organize the system. The equator divides the planet into northern and southern hemispheres. The prime meridian divides it into eastern and western hemispheres. Any point on the globe can be placed relative to these two lines. That is the geometric structure behind all coordinate-based globe tools.
Another important idea is that visual position may differ from perceived size. In a relief globe, mountains may look larger than they are in real life because the display exaggerates height slightly for readability. That is not an error. It is often a design choice to improve interpretation. Good visualization makes data easier to read, not merely more literal.
How to use an interactive 3D Earth globe effectively
Start with the map view and a neutral position. Then adjust latitude and longitude slowly. Watch how the surface marker or viewpoint moves. This creates an immediate understanding of where the coordinate system is located. After that, switch to relief mode to identify topography. Use night mode when studying illumination or the day-night boundary. Turn on rotation only after the user has understood the base orientation, because motion can make precise reading harder at first.

For educational work, it is often best to show one concept at a time. First the coordinate grid. Then the position values. Then the visual modes. Then the practical interpretation. This sequence keeps the learner focused and reduces confusion. A globe is powerful because it can show many things at once, but that strength should be managed carefully. Clarity always matters more than visual density.
Why a 3D globe is better than a flat map for many tasks
A flat map is ideal for some types of comparison, especially when exact planar measurements or thematic overlays are needed. But for understanding the planet as a sphere, a 3D globe is usually superior. It preserves curvature, direction, and spatial realism. It also makes the global context feel immediate rather than symbolic.
This matters when teaching beginners. A student can see that latitude is not simply a number on a page. It is a position around a curved body. Longitude is not just another axis. It is an angular placement around the Earth’s circumference. That difference is difficult to convey with a flat image alone.
It also matters in presentation. A globe creates strong visual impact without needing complex explanations. One rotation can communicate more than a paragraph of coordinate theory. That is why globe-based widgets are effective on educational pages and interactive knowledge platforms.
Technical terms worth knowing
| Term | Simple meaning | Why it matters | Related concept |
|---|---|---|---|
| Equator | Zero latitude line | Splits north and south | Latitude |
| Prime meridian | Zero longitude line | Splits east and west | Longitude |
| Hemisphere | Half of the globe | Defines global regions | Geographic division |
| Great-circle distance | Shortest path on a sphere | Used for Earth surface distance | Spherical geometry |
| Relief | Visible elevation pattern | Shows terrain structure | Topography |
Why the tool feels useful even to non-technical users
People do not need to know the mathematics of spherical geometry to benefit from a globe. The visual feedback does most of the work. Users see how a coordinate changes position. They see how continents wrap around the sphere. They see how the night side of Earth relates to rotation. This makes the globe approachable for both casual visitors and technical users.
That accessibility is important. A useful geography tool should not force the user to study a manual before gaining value. The interface should explain itself through motion, shape, and contrast. A well-designed interactive globe does exactly that.
When the interface also includes coordinate input, a user can jump directly to any location. This makes the globe useful not only for exploration but also for search and verification. It becomes a reference tool rather than just an animation.
Practical examples
If a user wants to inspect a point near the Arctic Circle, the latitude slider quickly reveals how far north that location is. If the goal is to compare Europe and Asia around the same latitude, the longitude control becomes the main variable. If the goal is to understand how high mountain belts shape a region, relief mode is the right choice. If the goal is to discuss the sunset line or the dark hemisphere, night mode is the most informative display. These examples show that the globe is not a single-purpose element. It adapts to different learning and presentation goals without changing the overall interface. That flexibility is one of its strongest advantages.
Books worth reading
The following books are useful for anyone who wants deeper background in geography, Earth systems, mapping, and spatial reasoning.
- National Geographic Atlas of the World
- How to Lie with Maps by Mark Monmonier
- General Cartography by mapping and geospatial reference authors
- Earth Science by Tarbuck and Lutgens
- Physical Geography by Christopherson, Birkeland, or similar standard texts
- Geography and You Can Understand the World by introductory geography authors
- Map Use by Arthur H. Robinson and colleagues
For a more mathematical path, books on spherical trigonometry, geodesy, and coordinate systems are also valuable. They explain why Earth calculations require curved geometry instead of simple flat formulas.
Final note
An interactive 3D Earth globe online is a compact but powerful educational tool. It turns global coordinates into visible movement, supports map and relief interpretation, and helps users understand Earth as a physical sphere. With latitude, longitude, rotation, and lighting controls, it offers a practical way to explore the planet from a browser window. For geography, astronomy, education, and visual storytelling, it remains one of the clearest and most effective interactive formats available.

Julian D. Thorne — Celestial Mechanics Developer
Researcher and 3D engine developer focused on interactive stellar systems. Julian bridges the gap between theoretical physics and real-time browser-based cosmos exploration.


