
Witnessing the luminous dance of the polar lights is a transformative event that has captivated humanity for millennia. The shifting curtains of emerald, violet, and crimson that illuminate the high-latitude night sky are not random atmospheric anomalies. They represent a grand visual manifestation of cosmic physics, where solar forces collide with planetary defenses. To fully appreciate this spectacle, one must venture beyond terrestrial boundaries into the upper reaches of the ionosphere, tracing the journey of energetic particles from the core of the Sun to the magnetic poles of Earth. Utilizing a sophisticated spatial overview helps enthusiasts and researchers map these celestial patterns, translating complex space weather into a comprehensible visual language.
Historically, these lights triggered both awe and terror. Indigenous cultures across the Arctic circle developed rich mythologies to explain the glowing ribbons. Some saw them as the spirits of ancestors playing games in the heavens, while others interpreted them as omens of conflict or shifting weather patterns. The modern era has swapped superstition for science, yet the sense of wonder remains undiminished. Today, chasing the aurora borealis in the north and the aurora australis in the south has evolved into a global phenomenon, drawing millions to the remote corners of our planet to gaze upward in silent reverence.
Contents
The Cosmic Engine: How Auroras Are Born
The journey of every auroral display begins approximately 150 million kilometers away at the center of our solar system. The Sun is a volatile thermonuclear reactor, constantly venting superheated plasma into space. This continuous stream of charged particles, consisting primarily of highly energetic electrons and protons, is known as the solar wind. The solar wind travels through the vacuum of interstellar space at staggering velocities, often exceeding several hundred kilometers per second, carrying with it the interplanetary magnetic field.
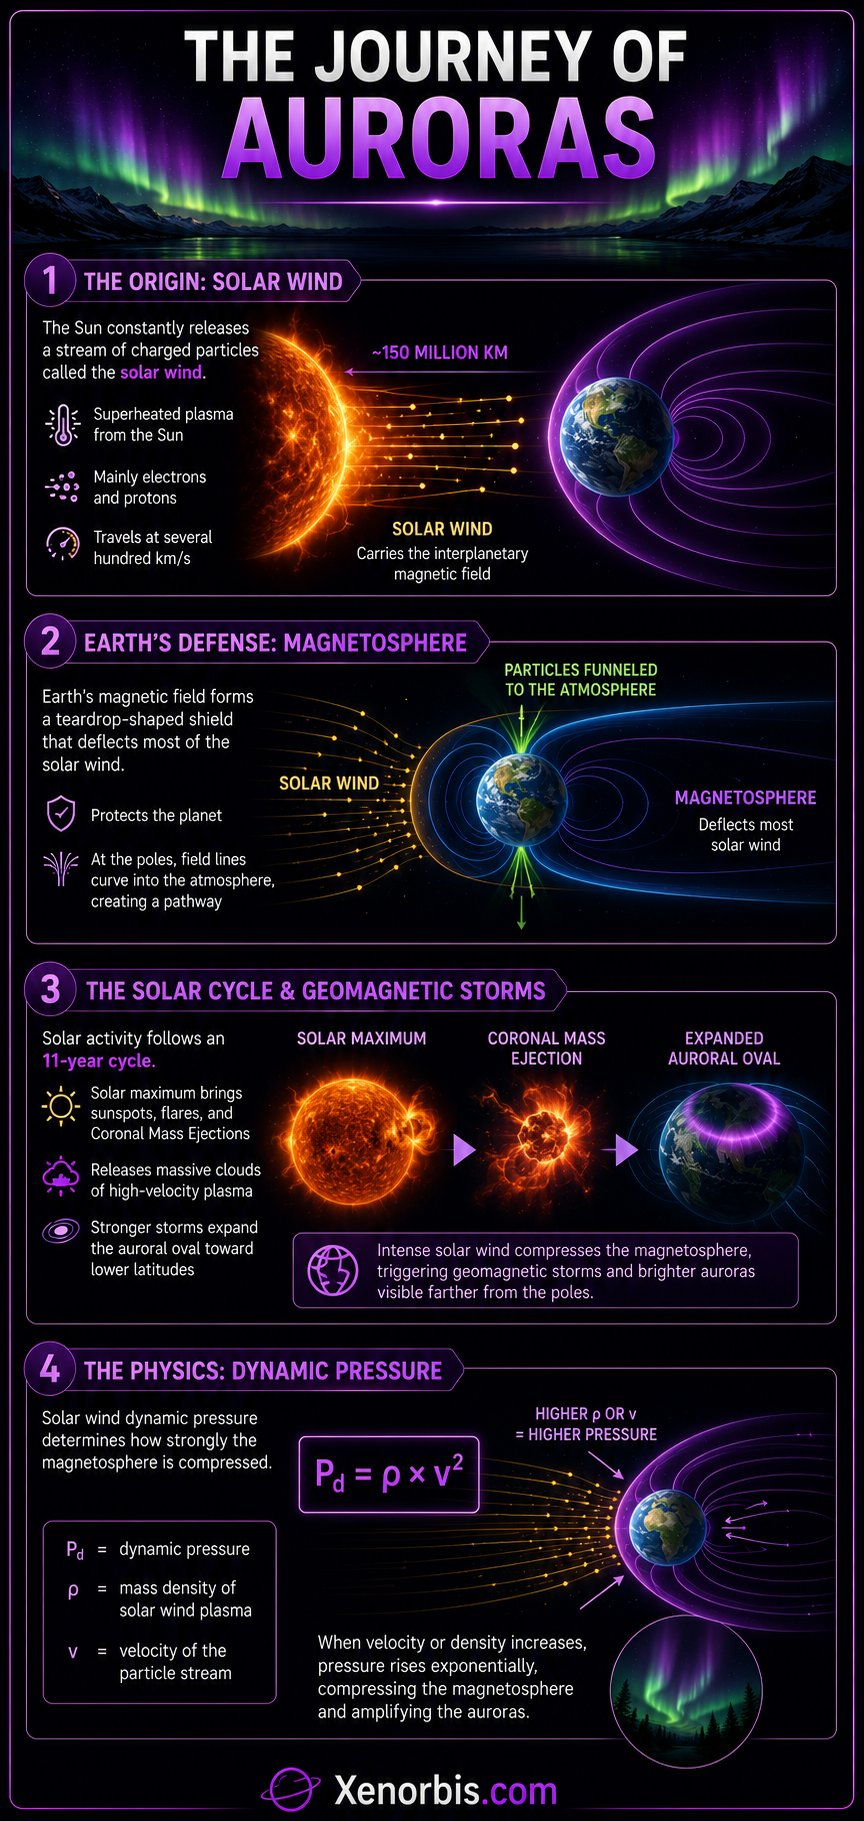
As this wave of solar plasma approaches Earth, it encounters our planet’s primary defense system: the magnetosphere. Generated by the churning molten iron core deep within Earth, the magnetosphere forms an invisible, teardrop-shaped shield that deflects the vast majority of the solar wind around the planet. However, this protective bubble is not entirely impenetrable. At the polar regions, Earth’s magnetic field lines curve sharply downward, funneling directly into the atmosphere. This structural vulnerability creates a pathway for the trapped solar particles to penetrate the upper atmospheric layers, setting the stage for the luminous collisions that follow.
The intensity of the solar wind is directly linked to the solar cycle, an 11-year fluctuation in the Sun’s magnetic activity. During periods of solar maximum, the solar surface erupts with massive sunspots, powerful solar flares, and colossal explosions known as Coronal Mass Ejections. These events unleash massive clouds of high-velocity plasma that strike the magnetosphere with immense force, triggering geomagnetic storms. When these intense streams of solar particles flow down the magnetic field lines, they compress the planetary shield and expand the auroral oval, pushing the spectacular displays further away from the poles toward mid-latitude regions.
The physics of these atmospheric interactions can be quantified through the calculation of solar wind dynamic pressure, which dictates how intensely the magnetosphere is compressed during a space weather event. The fundamental relationship governing this interaction is expressed below:
Pd = ρ × v2
In this equation, Psubscript d represents the dynamic pressure exerted on the magnetosphere, while ρ denotes the mass density of the incoming solar wind plasma, and v signifies the velocity of the particle stream. When the velocity or density escalates due to a solar eruption, the pressure climbs exponentially, forcing the magnetospheric boundary closer to the surface of the planet and amplifying the scale of the resulting polar lights.
The Chemistry of the Glowing Sky
When the energetic electrons of the solar wind finally breach the magnetosphere, they collide violently with the atoms and molecules of Earth’s upper atmosphere, primarily between 80 and 600 kilometers above the surface. These high-speed impacts transfer kinetic energy to the atmospheric gases, lifting their electrons into higher, unstable energy states. This state of temporary energy storage is known as excitation. Because atoms naturally seek stability, these excited electrons rapidly drop back down to their original ground states, releasing the excess energy in the form of a photon, a single particle of light.
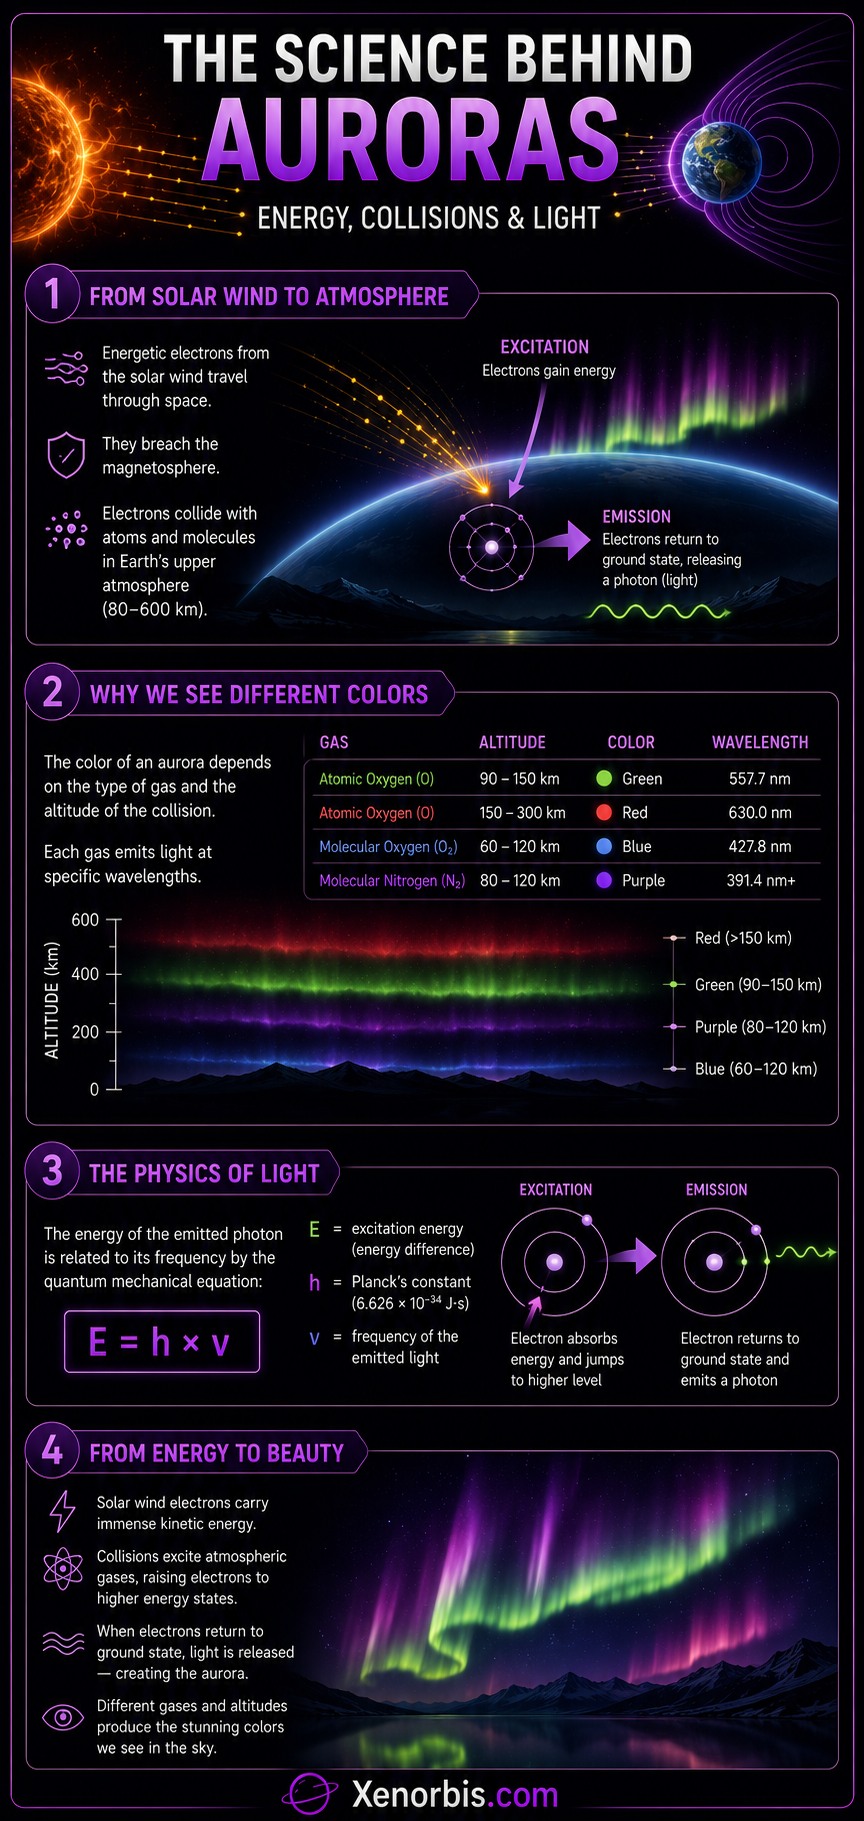
The specific colors observed during an auroral event are determined entirely by the type of gas molecule involved in the collision and the altitude at which the impact occurs. The composition of our atmosphere changes drastically with height. Near the surface, the air is a dense mixture of nitrogen and oxygen, but at the fringes of space, the air thins out significantly, and gases separate by weight. The energy of the incoming photon is directly related to the wavelength of light emitted, defined by the classic quantum mechanical relationship:
E = h × ν
Where E represents the excitation energy differential, h is Planck’s constant, and ν represents the frequency of the emitted light particle. Different gases possess unique electronic structures, meaning they can only absorb and release specific amounts of energy, resulting in a predictable spectrum of colors across different layers of the ionosphere.
| Target Atmospheric Gas | Altitude Range | Resulting Visual Color |
|---|---|---|
| Atomic Oxygen (Low Density) | 200 to 600 km | Deep Crimson / Ruby Red |
| Atomic Oxygen (High Density) | 100 to 200 km | Classic Emerald / Yellow-Green |
| Molecular Nitrogen (Ionized) | 80 to 120 km | Deep Violet / Vibrant Blue |
| Molecular Nitrogen (Neutral) | 80 to 100 km | Crimson Border / Magenta Lower Edges |
Green is overwhelmingly the most common color seen by observers on the ground. This specific emerald hue is produced by atomic oxygen at altitudes between 100 and 200 kilometers. The human eye is exceptionally sensitive to this wavelength, making green auroras appear exceptionally bright even during moderate solar activity. At higher altitudes, above 200 kilometers, the air density is incredibly low, allowing atomic oxygen to emit a rare, deep crimson light. This red aurora requires a longer transition time to emit its photon, meaning that if the atmosphere is too dense, the oxygen atom will collide with another molecule and lose its energy silently before it can flash. Therefore, red auroras only exist in the pristine, quiet heights of the upper thermosphere during powerful geomagnetic disruptions.
🌈 The lower boundaries of the auroral curtains, typically situated around 80 to 100 kilometers, present a completely different chemical profile. Here, the incoming solar particles have managed to penetrate deep into the atmosphere, where molecular nitrogen dominates. Collisions with nitrogen molecules yield vibrant purple, deep blue, and hot magenta borders. These colorful lower fringes often move with incredible speed, creating a fringed look that signals an exceptionally energetic storm.
Geomagnetic Activity and the Kp Index
To assist observers, scientists, and storm chasers in predicting the visibility of the polar lights, a specialized metrics system was developed to quantify global geomagnetic activity. The most widely utilized standard is the Planetary K-index, commonly referred to as the Kp index. This logarithmic scale ranges from 0 to 9 and represents an average of geomagnetic measurements taken by ground-based magnetometers situated across the globe over a three-hour interval.
✍ A low Kp index indicates a quiet magnetosphere, meaning the polar lights will be confined to their usual homes within the auroral ovals at high latitudes. As the Kp index rises, it signals that the magnetosphere is experiencing severe disturbances due to an influx of solar wind, causing the auroral oval to widen and shift toward the equator. This expansion allows residents of mid-latitude regions to view the phenomenon much lower on their northern or southern horizons.
| Kp Index Value | Geomagnetic Activity Level | Optimal Viewing Latitude |
|---|---|---|
| Kp 0 – Kp 1 | Quiet / Minimal Activity | Far Arctic Circle (70° N and above) |
| Kp 2 – Kp 3 | Unsettled / Low Activity | Northern Scandinavia, Interior Alaska |
| Kp 4 – Kp 5 | Active / Minor Storm | Southern Canada, Central Scotland |
| Kp 6 – Kp 7 | Moderate to Strong Storm | Northern USA, Baltic States, England |
| Kp 8 – Kp 9 | Severe to Extreme Storm | Mid-Latitude USA, Central Europe |
When tracking space weather, understanding the thresholds of the Kp index helps manage expectations. A rating of Kp 2 or 3 is standard for sub-Arctic regions, offering beautiful, localized displays for those positioned away from urban light pollution. Once the index reaches Kp 5, a official geomagnetic storm is declared. At this stage, the aurora intensifies dramatically, showing rapid structural changes and brighter color variations. Extreme events reaching Kp 8 or 9 are rare, occurring only a few times per solar cycle. These superstorms can alter planetary magnetic fields so severely that the northern lights become visible in areas as far south as Italy or the southern United States, though such events can also disrupt global power grids and satellite communications.
The Varied Shapes of the Polar Lights
The visual structure of an auroral display is never static. The lights constantly morph, shifting through distinct structural phases depending on the stability of the local geomagnetic field and the angle from which they are viewed from the ground. Scientists categorize these visual displays into several primary structural archetypes, each possessing its own unique motion dynamics and spatial characteristics.
The Main Structural Forms
- The Homogeneous Arc: This form represents the aurora in its most placid, restful state. It appears as a smooth, featureless ribbon of light stretching across the horizon from east to west. Arcs can persist for hours without significant modification, glowing with a soft green light. They serve as the baseline phase of a display, often acting as the calm before a major geomagnetic breakthrough.
- The Curtain: As the influx of solar wind increases, the smooth arc begins to develop instabilities. Vertical striations, known as rays, begin to form within the structure, aligning perfectly with Earth’s local magnetic field lines. The ribbon loops and folds over on itself, mimicking a giant, translucent curtain blowing in a cosmic breeze. These curtains can ripple with sudden bursts of speed, flashing brightly as current sheets sweep across the sky.
- The Diffuse Glow: Lacking distinct boundaries or structural definitions, the diffuse glow resembles an luminous cloud or a pale fog blanketing large patches of the sky. Often visible during the late-night recovery phase after a powerful storm has peaked, these glows are caused by lower-energy electrons scattering widely across the ionosphere. They are frequently pulsating, rhythmically brightening and dimming over cycles of several seconds.
- The Corona: This form represents the absolute zenith of an auroral display, a breathtaking crown of light that occurs when an active, rayed aurora passes directly above the observer’s location. Because the parallel magnetic field lines are streaming straight down toward the ground, perspective causes the rays to appear to converge at a single central point in the upper sky, known as the magnetic zenith. This illusion creates a spectacular, exploding starburst effect that fills the entire field of view.
The transformation from a quiet arc into a raging curtain and finally into a spectacular overhead corona is driven by a process called an auroral substorm. These sudden releases of energy occur when magnetic field lines in the magnetotail, the portion of the shield dragged behind Earth by the solar wind, stretch to a breaking point, snap, and reconnect. This magnetic snapping hurls massive quantities of trapped electrons back toward the night side of Earth with incredible velocity, causing the northern lights to suddenly explode in brightness and movement, an event known as an auroral breakup.
Top Geographic Locations for Sky Watchers
Because the planetary magnetic field concentrates the auroral activity into a ring centered around each magnetic pole, geography plays a decisive role in determining the likelihood of witnessing a display. This zone of consistent activity is known as the auroral oval. To maximize the chances of a successful viewing expedition, travel planners and night-sky photographers focus their efforts on a select group of high-latitude regions positioned directly underneath this glowing ring.
| Geographic Region | Optimal Viewing Window | Primary Visual Advantages |
|---|---|---|
| Tromsø, Norway | September to April | Mild coastal temperatures, stable infrastructure |
| Fairbanks, Alaska | Late August to April | Clear interior weather, high continental location |
| Yellowknife, Canada | December to March | Exceptionally flat terrain, minimal cloud cover |
| Reykjavík, Iceland | September to April | Accessible wilderness landscapes, volcanic backdrops |
When selecting a destination, weather and local topography are just as critical as latitude. For instance, coastal locations like Tromsø or Iceland benefit from the warming effects of the Gulf Stream, making winter temperatures far more tolerable for observers standing still for hours in the dark. However, these maritime climates are also prone to sudden cloud cover, which can completely obscure a brilliant display occurring above the storm clouds. Conversely, interior continental locations like Fairbanks or Yellowknife experience brutal winter cold, but their dry, stable air masses offer significantly higher percentages of completely clear nights, ensuring unhindered views of the ionosphere.
Timing is equally vital. While auroras occur year-round, they are completely invisible during the summer months at high latitudes because of the persistent midnight sun. The optimal viewing season spans from late autumn to early spring, when the night skies are deep and prolonged. Additionally, the weeks surrounding the autumn and spring equinoxes in September and March traditionally exhibit higher frequencies of geomagnetic disturbances. This phenomenon, known as the Russell-McPherron effect, occurs because the orientation of Earth’s magnetic poles aligns favorably with the interplanetary magnetic field, allowing the solar wind to breach our planetary defenses with greater ease.
The Value of Visual Simulation Tools
Given the unpredictable nature of space weather, geographic limitations, and the high financial costs associated with Arctic travel, digital exploration tools have become indispensable resources. A modern 3D simulation platform allows users to manipulate parameters such as solar wind density, Kp index levels, and gas mixtures instantly, gaining an intuitive understanding of global mechanics that cannot be achieved through reading static text alone. By observing how changing the Kp index alters the thickness and latitude of a digital auroral band, enthusiasts can prepare themselves for real-world hunting expeditions, knowing precisely what structural forms to expect when space weather alerts flash on their devices.
Furthermore, these interactive environments decouple the viewing experience from weather dependencies and light pollution. They offer an ideal training ground for students and educators to study atmospheric chemistry, thermodynamics, and electromagnetism in a highly engaging environment. Users can rotate their perspective around the digital dome, viewing the aurora from a distant satellite viewpoint or standing directly underneath the virtual curtains to watch the convergence of a simulated corona. Bridging the gap between rigid laboratory data and artistic rendering, these tools foster a deeper public appreciation for the delicate, beautiful shield that protects life on Earth from the harsh realities of our dynamic solar system.
Recommended Reading
- The Aurora: A Comprehensive Introduction — Syun-Ichi Akasofu
- Northern Lights: The True Story of the Man Who Unlocked the Secrets of the Aurora Borealis — Lucy Jago
- Auroral Physics — David J. Knudsen, Joe Borovsky, and Richard Denton
- The Northern Lights: Celestial Visions of the Northern Sky — Sergey Anisimov
- Majestic Lights: The Aurora in Science, History, and the Arts — Robert H. Eather

Julian D. Thorne — Celestial Mechanics Developer
Researcher and 3D engine developer focused on interactive stellar systems. Julian bridges the gap between theoretical physics and real-time browser-based cosmos exploration.


